
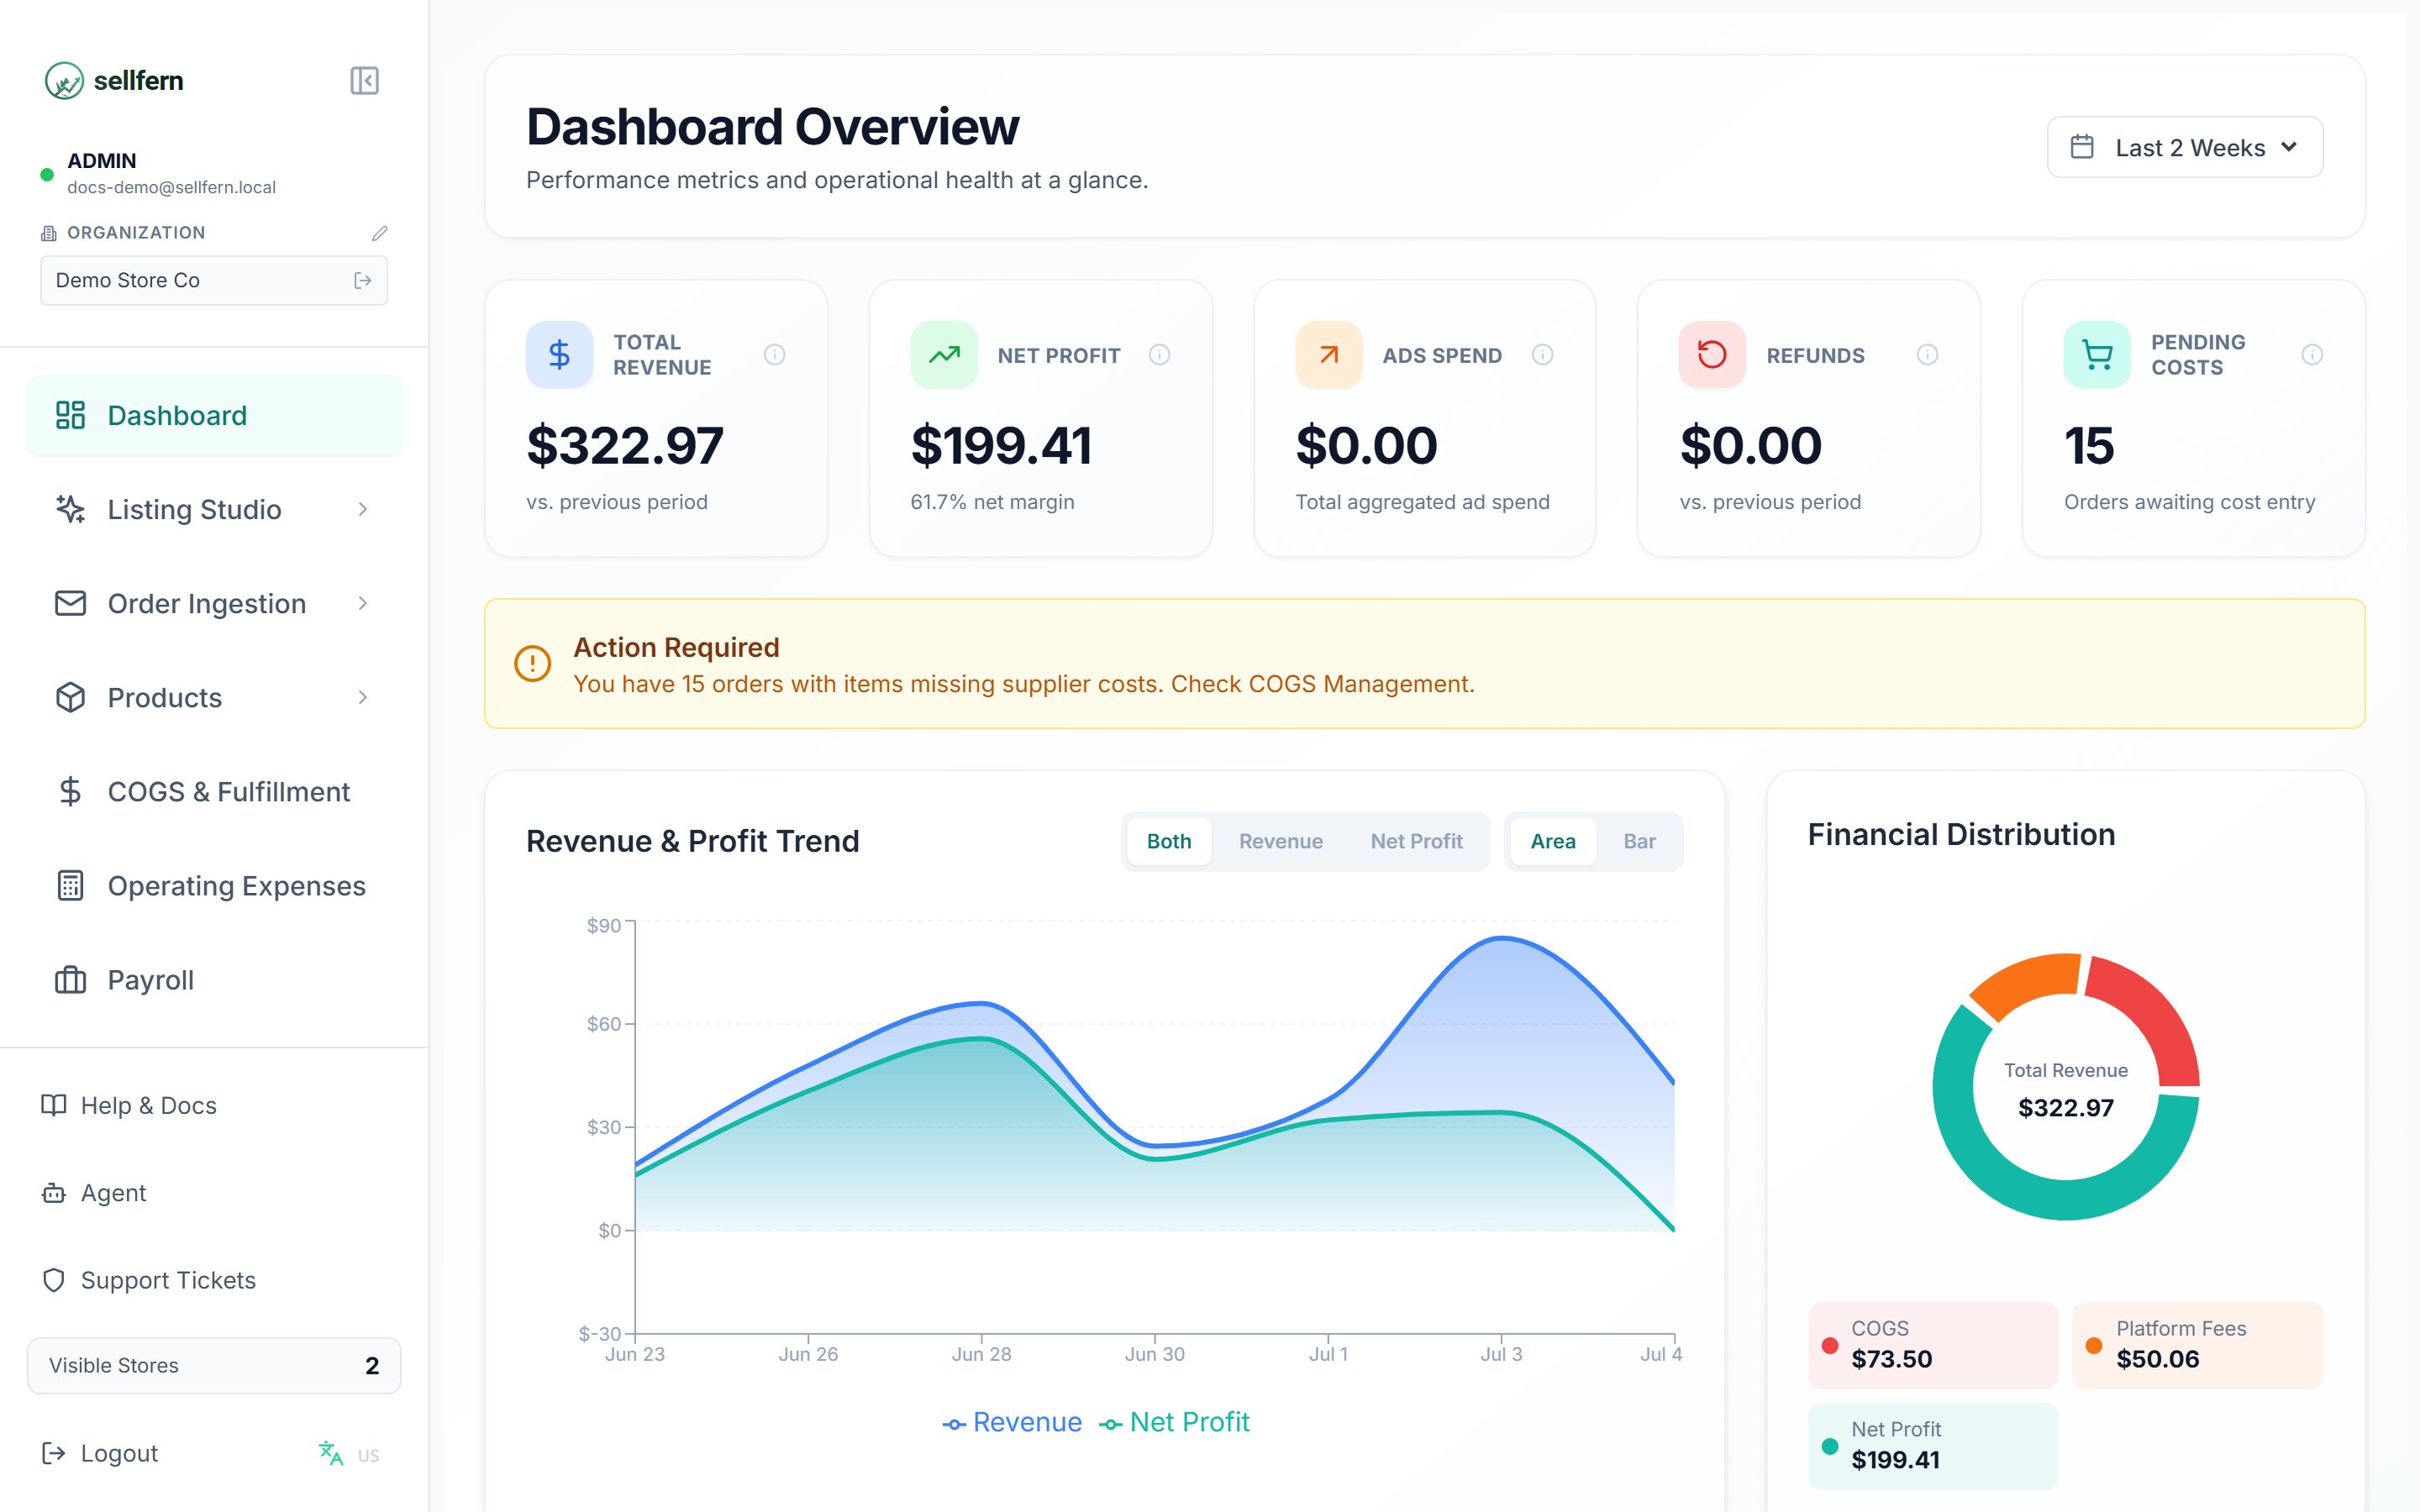
The Dashboard with stat cards, the pending-costs alert, the revenue chart, and the financial distribution donut
Choosing a date range
The date-range picker at the top of the page drives every number on the Dashboard. Available presets:- Last 7 days
- Last 2 weeks
- Last 30 days
- Month to date (MTD)
- Last month
- This quarter
- Year to date (YTD)
- Custom — pick your own start and end dates.
Stat cards
The Pending Costs card is the most important operational alert on the Dashboard. Items without costs cannot move to production and skew your profit numbers. Click the alert to open COGS & Fulfillment and resolve them.
Revenue over time
The main chart shows daily revenue for the selected period, with three view modes:- Both — stacked bars of costs and profit; the bar total equals revenue.
- Revenue — revenue line only.
- Profit — profit line only.
Financial distribution
The Financial Distribution donut splits revenue into its components:- COGS — cost of goods sold (supplier costs).
- Ads — recorded advertising spend.
- Platform Fees — Etsy/marketplace fees.
- Refunds — money returned to customers.
- OpEx — other operating expenses.
- Profit — what remains.
Where the data comes from
The Dashboard is only as accurate as its sources:- Revenue comes from orders ingested via Order Ingestion.
- COGS comes from base costs assigned in Costs & Fulfillment.
- Ads and OpEx come from Operating Expenses.